This brief post analyzes some aggregate information about the state of penetration testing in 2018. It will aggregate the results of several reports on pentesting, compare and contrast them, and derive some new information with the goal of improving pentesting performance. The ultimate goal is to inform and improve my own pentesting.
Overview
The writing here is based on nine separate reports on penetration testing. The reports were chosen because they report on pentesting activities within the last year.
Four are summaries of a bug bounty programs by two targets. Four are the 2017 and 2018 reports by Rapid7 and HackerOne (they are Rapid7 2017, Rapid7 2018, HackerOne 2017, and HackerOne 2018. The final source is Bugcrowd’s 2018 state of bug bounty report.
These reports all contain interesting observation and anecdotes about pentesting, but this post tries to eke out some additional information. Specifically, the hope was that information relevant to the pentester could be derived from the raw data available, rather than a more program- or customer-centric view.
The specific bug bounty program reports provided details about how pentesting/bug hunting evolve over time. Because it contained more details about how many researchers were involved, they provided data on the effectiveness of pentesters.
The annual reports by HackerOne, Rapid7, and Bugcrowd provided high level information from which aggregate data on the types of vulnerabilities found by pentesters. Note that while HackerOne and BugCrowd pentests are performed over time as a company participates in the programs, the Rapid7 reporting comes from their pentesting service which typically runs for less than two weeks.
Bug bounty reports 1-3
Three of the bug bounty summary reports were of the same participant over a six month period. A few interesting data are derived.
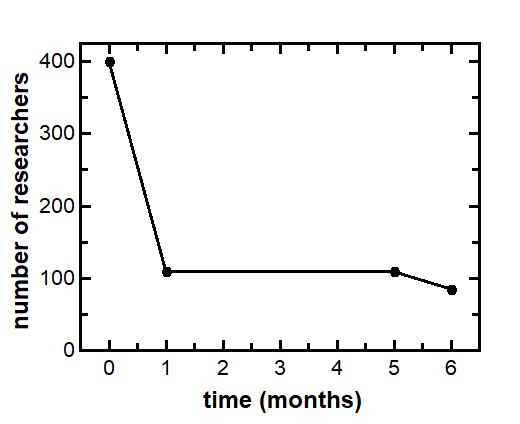
First, while the bug bounty program attracted many researchers initially, the number dropped very quickly within the first month and remained fairy stable over the remainder of time. The drop was from 400 to 100 researchers apparently active on the bug bounty. This suggests that only 25% of researchers were persistent and successful in finding vulnerabilities. The results are in the figure below.

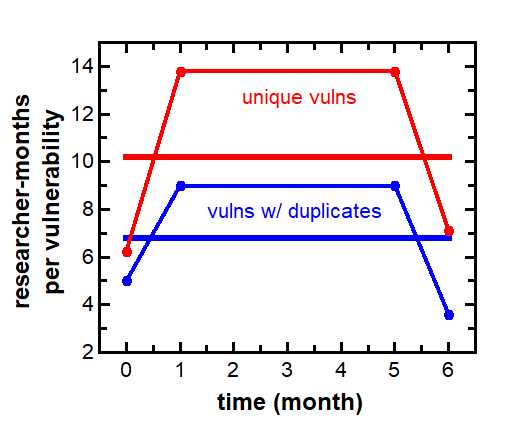
These reports also allowed calculation of the success rate of researchers. This is calculated as the number of researcher-months that were required to find a vulnerability throughout the bug bounty program. The success rate was calculated for unique vulnerabilities and for those plus duplicate vulnerabilities. The rate of duplication ranged from 25 to 100%.
The success rates for vulnerabilities including duplicates were between 3.6 and 9 researcher-months (averaging 6.8 overall). The success rates for unique vulnerabilities were between 6.3 and 13.8 researcher-months (averaging 10.2 overall). See the figure below.

These are surprisingly long times, although some of it is offset because of the uneven distribution of vulnerability discovery among the researchers. The same bug bounty participant can be found on Bugcrowd and lists in their Hall of Fame the points awarded to researchers. Using that list, a sense of the difference in bug discovery among researchers can be found.
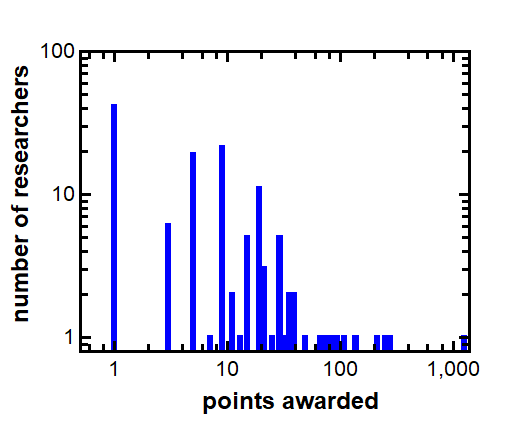
The first Figure simply shows the number of researchers who were awarded points under this participant’s bug bounty program. Note that most researchers score in the single or double digits, many score triple digits, and a single researcher scored more than a thousand points.

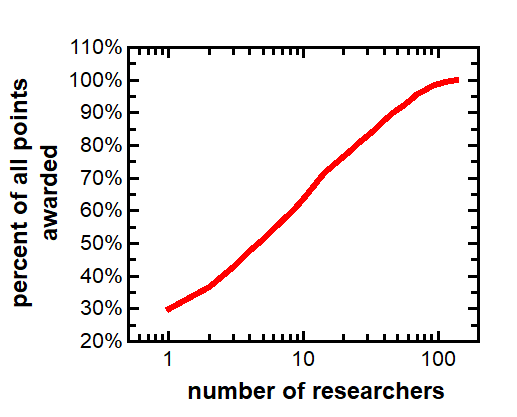
This same data can be shown as a cumulative distribution function, showing the percentage of points awarded to the top N bug hunters. The top five bug hunters accumulated about half of all points awarded; the top 18 accumulated 75% of all points; and the top 47 accumulated 90% of all points awarded. See the figure below.

This curve nearly conforms to the Pareto principle, where 80% of the points were awarded to 25% of the bug hunters. So perhaps the success rates for unique vulnerabilities of 6.8 researcer-months is more realistically closer to 1.7-3.4 months.
Bug bounty report 4
This report was a private program over one year with only a dozen bug hunters, and the results suggest that the target was more “hardened” than the first example. As a result the program showed 10.6 researcher-months for vulnerabilities including duplicates, and 18 researcher-months per unique vulnerability.
Rapid7, HackerOne, and BugCrowd reports
This just to contrast the annual reports from these three organizations. Rapid7 deploys pentesters on contract typically lasting less than two weeks. These are likely more experienced pentesters than those at HackerOne and BugCrowd. The bug bounty programs will included a wider range of experience levels, but also provide more time for deeper vulnerabilities to be found.
Note that Rapid7’s 2018 report incorporated “other” vulnerabilities, which seemed to throw off the counting. They appear to be meant to involve combinations of specific vulnerabilities, but makes it impossible to differentiate between them. So to calculate Rapid7’s results on the distribution of vulnerabilities, the “other” category was excluded and it was assumed that the distribution of specific vulnerabilities would be reflected among the “other” category as well.
Vulnerabilities found by type
We end with a table of vulnerability types encountered by the five different scenarios: two indivdiual Bugcrowd programs, and annual summary reports from Rapid7, HackerOne, and Bugcrowd. Note that some categories conflict or overlap between reports, so they were combined when possible but counted separately when necessary.

XSS is the vulnerability that is current, common vulnerability both in bug bounty programs and in pentesting engagements. Server securty misconfiguration, CSRF, and unvalidated or open redirects and forwards are also consistent among those scenarios, though less though. This appears to be consistent as current trends in the industry, based on the usual open sources.
It appears that SQLi has decreased significantly as what at one time seemed to be a prevelant vulnerability. It seems to be encountered less often (it’s been anecdotally suggested that they still exist but require manual and persistent testing).
Conclusion
- Bug bounty participation drops precipitously at the beginning and stabilizes.
- Vulnerabilities, though common, require time and people to expose.
- Vulnerabilities are mostly found by the top 25-50% or so of bug hunters.
- XSS, server misconfiguartion, CSRF, and unvalidated redirects and forwards are the vulnerabilities du jour.